Monthly PPC dashboard: $18,400 ad spend, 12,600 clicks, $1.46 average CPC, 4.2% click-through rate, Quality Score 8/10. Campaign status: "Performing well."
Actual business results: 378 conversions, 3% conversion rate, $48.68 cost per acquisition, $32,130 revenue generated. ROI: 75% ($18,400 spent, $13,730 profit lost vs. breakeven).
Google Ads specialist analysis: "Campaigns optimized. CTR above benchmark. Quality Score strong. Consider increasing budget to scale winners."
Missing from analysis: Why 97% of paid clicks never convert. What happens after visitors land. Which page elements cause immediate bounces. Whether landing page matches ad promise. If mobile traffic encounters friction desktop traffic avoids.
PPC metrics measure ad delivery performance—impressions, clicks, CTR, CPC, Quality Score. These metrics cannot diagnose landing page friction destroying conversions after clicks arrive. CRO analyzers fill this diagnostic gap revealing why paid traffic bounces, which barriers block conversions, and what fixes would improve PPC ROI without increasing spend.
"Half the money I spend on advertising is wasted; the trouble is I don't know which half." — John Wanamaker
The PPC Metrics Blind Spot: What Happens After the Click
Google Ads dashboard reports campaign performance metrics:
Impressions: 300,000 (ad displayed)
Clicks: 12,600 (4.2% CTR)
Average CPC: $1.46
Quality Score: 8/10
Conversions: 378 (3% conversion rate)
Cost per conversion: $48.68
These metrics answer: Did ads get shown? Did people click? How much did clicks cost? Did some conversions occur?
These metrics cannot answer: Why did 97% of clicks not convert? What caused bounces? Which landing page elements failed? Do mobile and desktop experience different friction? Does page content match ad promise?
The diagnostic gap leaves PPC specialists optimizing ad delivery while landing page barriers destroy conversion potential.
What PPC Metrics Measure vs. What They Miss
PPC metric: Click-through rate (4.2%)
Measures: Ad relevance, headline appeal, offer interest
Misses: Whether landing page delivers on ad promise causing immediate bounce
Example: Ad promises "Free shipping on all orders" but landing page shows "$12.99 shipping" creating expectation violation. High CTR (ad worked) but immediate bounce (landing page broke promise). PPC metrics show successful ad, miss broken fulfillment.
PPC metric: Quality Score (8/10)
Measures: Expected CTR, ad relevance, landing page experience (Google's assessment)
Misses: Specific friction points blocking actual conversion—form complexity, missing trust signals, mobile UX barriers
Example: Google Quality Score rates "landing page experience" as good, but page contains 11-field checkout form (research shows reducing to 4 fields increases conversions 120%), security badges below fold on mobile (82.9% of traffic per industry data), and 6.2 second mobile load time (53% abandon sites loading over 3 seconds). Quality Score cannot diagnose these specific barriers.
PPC metric: Conversion rate (3%)
Measures: Aggregate conversion percentage
Misses: Device-specific conversion gaps, friction point locations, abandonment triggers
Example: Desktop converts at 5.8%, mobile at 1.9% (mobile represents 82.9% of landing page traffic). Aggregate 3% conversion masks mobile friction destroying majority of paid traffic opportunity. PPC metrics show overall conversion, miss device-specific barriers.
PPC metric: Cost per conversion ($48.68)
Measures: Efficiency of ad spend per conversion
Misses: How many conversions were lost to fixable landing page friction vs. targeting issues
Example: 12,600 clicks at 3% conversion = 378 conversions. If landing page friction (fixable via CRO analyzer) causes 50% of non-conversion, fixing friction could yield 6,300 clicks × 6% = 378 additional conversions at same ad spend. CPA would drop from $48.68 to $24.34. PPC metrics measure current efficiency, cannot identify improvement potential.
How CRO Analyzers Diagnose Paid Traffic Landing Page Friction
CRO analyzers evaluate landing pages receiving paid traffic identifying specific barriers PPC metrics cannot detect:
Diagnostic Category 1: Ad-to-Page Message Match
PPC metric view: 4.2% CTR indicates strong ad relevance
Analyzer diagnosis: Ad headline "Get 50% Off Your First Order" but landing page headline "Premium Products for Discerning Customers" creating disconnect
Friction identified:
Ad emphasizes discount, landing page emphasizes premium positioning
Visitor expects price-focused offer, page presents quality-focused messaging
No prominent display of advertised 50% discount above fold
Coupon code mentioned in ad but redemption instructions absent from page
Fix specification: "Align landing page headline with ad offer: '50% Off Your First Order — Premium Quality, Half Price.' Position discount prominently above fold. Add coupon code auto-apply or clear redemption instructions within first screen."
Expected impact: Message match prevents immediate confusion-driven bounces. Ad promised discount, page must deliver discount messaging first screen.
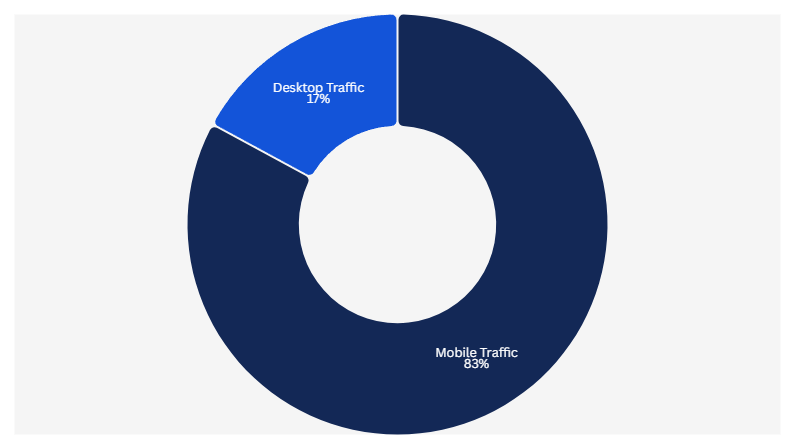
Diagnostic Category 2: Mobile Landing Page Friction (82.9% of Traffic)
PPC metric view: Mobile campaigns show 3.8% CTR, Quality Score 7/10
Analyzer diagnosis: Landing page optimized for desktop, mobile users encounter multiple barriers
Friction identified:
Primary CTA positioned 2,340 pixels below fold on mobile (requires 3.2 screen scrolls)
Touch targets measure 36x40 pixels (below recommended 44x44 minimum)
Page weight 4.8MB causing 8.1 second load on 3G (53% abandon over 3 seconds per research)
Form fields trigger wrong keyboard types (email field shows phone keyboard)
Hero image extends beyond viewport causing horizontal scroll
Fix specification: "Move CTA above fold on 375px viewport. Increase button touch targets to 48x48 pixels. Optimize images reducing page weight to 1.2MB. Add input type='email' to email field. Fix viewport meta tag preventing horizontal scroll."
Expected impact: Mobile represents 82.9% of landing page traffic per industry data. Removing mobile friction affects majority of paid clicks.
Diagnostic Category 3: Trust Signal Deficiency
PPC metric view: Conversion rate 3%, indicating interest but low completion
Analyzer diagnosis: Landing page lacks trust signals necessary for purchase decision
Friction identified:
Zero customer reviews visible above fold
Security badges absent from checkout entry
Return policy requires footer navigation to find
No phone number or customer service contact visible
Shipping costs undisclosed until checkout step 3
Fix specification: "Add verified review summary (4.7/5 stars from 2,847 reviews) within first screen. Position security badge near primary CTA. Add return policy summary '30-day returns, free return shipping' above fold. Display customer service phone number in header. Show shipping estimate at product selection."
Expected impact: Trust deficiency prevents conversion despite ad successfully driving interested traffic. Reviews, guarantees, and contact information reduce purchase hesitation.
Diagnostic Category 4: Form Complexity Blocking Completion
PPC metric view: Clicks convert at 3%, suggesting qualification issues
Analyzer diagnosis: Qualified traffic abandons due to checkout form friction
Friction identified:
Checkout requires 11 fields (name, email, phone, company, address 1, address 2, city, state, ZIP, country, shipping preference)
Research shows reducing form fields from 11 to 4 increases conversions by 120%
Address line 2 incorrectly marked required (should be optional)
Phone field lacks explanation why needed
No real-time validation (errors shown only after submission)
Fix specification: "Reduce required fields to 5 (name, address, city, state, ZIP). Mark phone, company, address line 2 optional. Add tooltip explaining phone for delivery coordination. Implement real-time validation showing specific requirements."
Expected impact: Form friction affects qualified buyers ready to purchase. Reducing 11 fields to 5 based on form optimization research removes completion barrier.
Diagnostic Category 5: Load Performance Killing Mobile PPC Traffic
PPC metric view: Mobile Quality Score 7/10 (landing page experience component rated "average")
Analyzer diagnosis: Page performance destroys mobile conversion despite acceptable Quality Score
Friction identified:
Mobile load time: 8.3 seconds (53% of mobile visitors abandon sites loading over 3 seconds)
Largest Contentful Paint: 6.7 seconds
Time to Interactive: 9.2 seconds
Page weight: 5.1MB (images unoptimized, JavaScript bundles too large)
Performance bottlenecks:
Hero image: 2.3MB (should be under 150KB)
Product images: 1.8MB total (should be compressed)
JavaScript bundles: 940KB (should be code-split and deferred)
Third-party scripts: 520KB (analytics, chat widget loading synchronously)
Fix specification: "Compress hero image to WebP format under 150KB. Optimize product images to 50-80KB each. Code-split JavaScript bundles, defer non-critical scripts. Async-load third-party scripts. Target total page weight under 1.5MB, load time under 3 seconds on 3G."
Expected impact: Mobile represents 82.9% of landing page traffic. 53% abandon over 3 seconds means current 8.3-second load loses majority of paid mobile clicks before page becomes usable.
The PPC Waste Calculator: Conversion Lost to Fixable Friction
CRO analyzers quantify revenue lost to landing page barriers versus targeting or offer problems:
Campaign performance:
Monthly spend: $18,400
Clicks: 12,600
Current conversion rate: 3%
Conversions: 378
Revenue: $32,130 ($85 AOV)
Analyzer friction diagnosis:
Mobile load time friction: Loses estimated 45% of mobile conversions
Form complexity friction: Loses estimated 30% of checkout attempts
Missing trust signals friction: Loses estimated 20% of qualified buyers
Message mismatch friction: Loses estimated 15% to immediate bounce
Conservative estimate: If fixing diagnosed friction recovers 40% of lost conversions:
Potential performance (same ad spend):
Clicks: 12,600 (unchanged)
Conversion rate: 4.2% (up from 3%)
Conversions: 529 (up from 378)
Revenue: $44,965 (up from $32,130)
Additional revenue: $12,835 monthly from same $18,400 spend
New ROI: 144% vs. current 75%
This calculation reveals PPC budget efficiency problem: Spending $18,400 driving clicks that landing page friction destroys. Fixing friction captures conversions already paid for via ad clicks.
The Combined PPC + CRO Analyzer Workflow
Effective paid traffic optimization requires both PPC metrics and landing page friction diagnosis:
Workflow Step 1: PPC Campaign Optimization (Traditional)
Google Ads specialist focus:
Keyword research and selection
Ad copy testing and optimization
Bid strategy adjustment
Audience targeting refinement
Negative keyword management
Outcome: Strong CTR (4.2%), acceptable CPC ($1.46), good Quality Score (8/10)
Workflow Step 2: Landing Page Friction Diagnosis (CRO Analyzer)
Analyzer focus:
Message match between ad and landing page
Mobile-specific friction (82.9% of traffic)
Trust signal presence and placement
Form complexity and field requirements
Load performance and technical barriers
Outcome: Specific friction points identified with fix specifications
Workflow Step 3: Prioritized Fix Implementation
High-priority fixes (affecting majority of paid traffic):
Mobile CTA positioning above fold
Page weight optimization (8.3 seconds to under 3 seconds)
Message match between ad promise and page headline
Form field reduction (11 to 5 fields)
Medium-priority fixes:
Trust signal placement near CTA
Input type corrections for mobile keyboards
Real-time form validation
Shipping cost transparency
Low-priority fixes:
Desktop layout optimizations (17.1% of traffic)
Advanced personalization
Minor copy refinements
Workflow Step 4: Conversion Rate Monitoring
Metrics tracked:
Overall conversion rate change
Device-specific conversion (mobile vs. desktop)
Bounce rate at landing
Form completion rate
Revenue per click improvement
Success indicators:
Conversion rate increases from 3% to 4-6%
Mobile conversion gap closes (1.9% approaching desktop 5.8%)
Cost per conversion decreases
Revenue per click increases
ROI improves without increased ad spend
Why PPC Specialists Miss Landing Page Friction
PPC management focuses on auction dynamics, ad creative, and keyword targeting. Landing page optimization requires different expertise:
PPC specialist training: Keyword research, bid management, audience targeting, ad copy, Quality Score factors
CRO analyzer training: UX friction diagnosis, mobile optimization, form analysis, conversion psychology, technical performance
Knowledge gap example:
PPC specialist sees 3% conversion rate and optimizes ads to improve Quality Score
CRO analyzer sees 3% conversion, diagnoses 11-field form blocking 70% of purchase attempts, reduces to 5 fields based on research showing 120% conversion increase
Both disciplines necessary: PPC drives qualified traffic, CRO removes barriers preventing conversion.
How BluePing Reveals What PPC Dashboards Cannot
BluePing analyzes landing pages receiving paid traffic identifying friction destroying PPC ROI:
Input: Landing page URL from PPC campaigns
Analysis: Mobile friction (82.9% traffic), message match with ads, trust signals, form complexity, load performance
Output: Specific barriers blocking paid traffic conversion with fix specifications
Example diagnosis:
"Landing page friction analysis for PPC campaign:
Message match: Ad promises 'Free 2-day shipping' but landing page shipping section mentions '$12.99 standard shipping' without highlighting free 2-day option. Disconnect between ad promise and page content.
Mobile friction (82.9% of paid traffic): Primary CTA 2,640 pixels below fold requiring 3.6 screen scrolls. Page weight 5.2MB causing 9.1 second load on 3G (53% abandon over 3 seconds per research). Touch targets 38x42 pixels (below 44x44 minimum).
Trust deficiency: Security badge located in footer 1,840 pixels below payment entry. Zero customer reviews above fold. No return policy visible.
Form complexity: Checkout requires 11 fields (research shows reducing to 4 increases conversions 120%). Phone field marked required without explanation.
Priority fixes:
- Add 'Free 2-day shipping on orders $50+' above fold matching ad promise
- Move CTA within first mobile screen (0-667 pixels)
- Optimize images reducing page weight to 1.5MB, load time under 3 seconds
- Reduce checkout to 5 required fields
- Position security badge and reviews near CTA"
These specific diagnoses enable fixing landing page friction consuming PPC budget—not through increased ad spend or better targeting, but through removing barriers blocking conversions from clicks already purchased.