
A five-second pause on your checkout can cost thousands, and the problem may be the trust you build. Not the traffic. Buyers hesitate when design feels unclear, buttons shift, or pages stall. That’s where a UX audit earns its value: it catches the friction your analytics can’t explain before it becomes lost revenue.
What Friction Really Looks Like on a Page
Friction isn’t always ugly design. It’s the invisible resistance between intention and action—an uncertain button, a misplaced testimonial, a delivery date that appears too late. Most teams only see numbers in analytics; a UX audit reveals what those numbers mean.
As covered in Rich Results That Sell: Ecommerce SEO Services for Product, Price, and Proof, clarity doesn’t come from visuals alone. It’s how quickly the buyer sees reason to act.
“Simplicity is the ultimate sophistication.” — Leonardo da Vinci
The Five Signals of Conversion Drag
A professional UX audit uncovers five recurring signals that predict sales loss:
- Hidden Intent: Users hover or scroll without committing because key actions blend into the layout.
- Misdirected Proof: Testimonials or guarantees buried where no one reads them.
- Cognitive Load: Overdesigned product cards that make comparing options harder.
- Speed Mismatch: CTAs that load slower than attention spans last.
- Unclear Feedback: Clicks that give no visible confirmation or progress cue.

Each of these moments costs more than design time—it costs trust.
How UX Audits Drive Predictable Wins
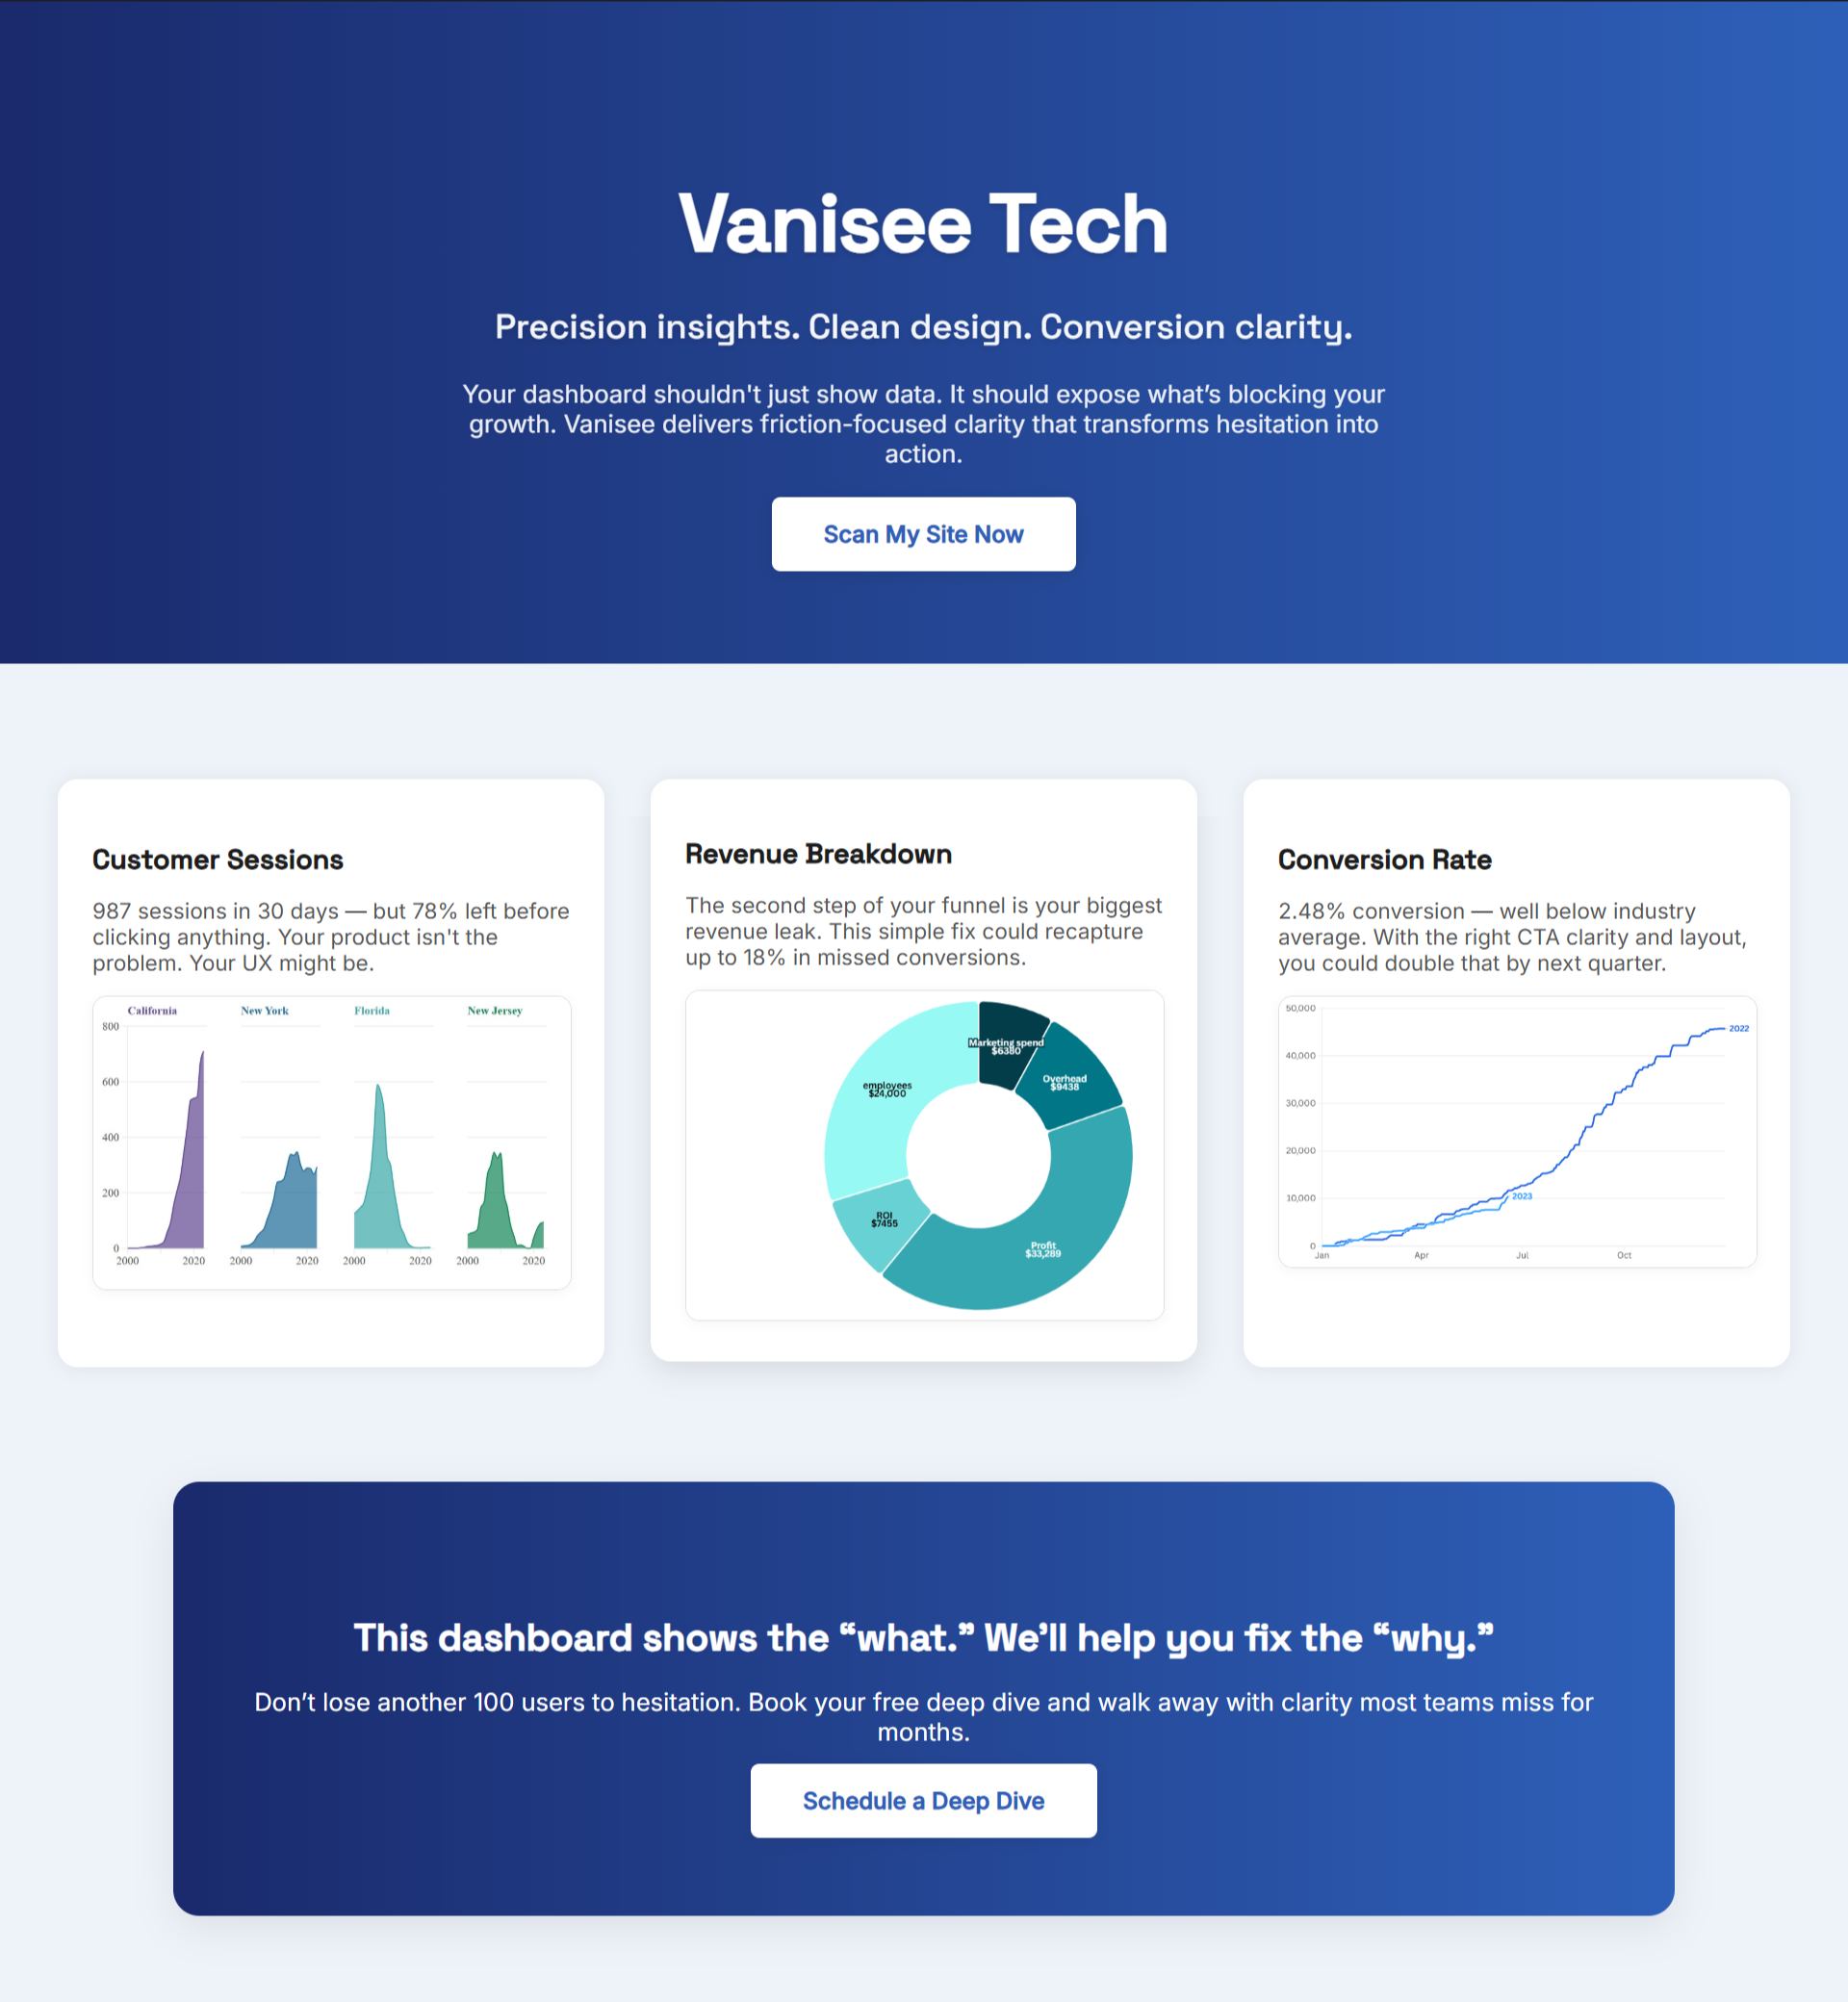
When teams treat UX audits as data systems instead of design reviews, clarity becomes measurable. You can see where each change increases scroll completion, decreases bounce, or lifts add-to-cart rates.
A recent post, Ecommerce SEO Services That Keep Sales Moving When Items Are Out of Stock, shows how small shifts in UX placement can lift recovery clicks by double digits. The same rule applies here: the right fix isn’t creative—it’s structural.
Audits let you act without guessing. Each insight connects visual hesitation to financial impact.
The Weekly UX Audit Cycle
Great UX isn’t one report—it’s repetition. Each week, audit one page type and track behavioral improvement.
- Monday: Record sessions on your highest-traffic template.
- Wednesday: Rank friction by lost clicks.
- Friday: Fix one layout issue and measure scroll depth.
The data compounds. Each small fix builds a friction-free funnel.
Where BluePing Fits
Instead of waiting for design teams, BluePing runs the same diagnostic logic in seconds. It spots skipped buttons, dead zones, and layout fatigue before they impact revenue.
You’ll see where users hesitate—and why—without spending weeks in heatmaps. The scan takes 30 seconds, your preview locks after 10 minutes for data protection, and the full report unlocks for $395. Hundreds of teams are already using it to find invisible friction before redesigning a thing.
.png)
.png)
.png)