

Monthly analytics review: Traffic up 23%. Bounce rate: 64%. Add-to-cart rate: 2.8%. Checkout completion: 31%. Time on page: 47 seconds average.
Team question: "What should we test next?"
Proposed tests: Change button color from blue to green. Test longer vs. shorter headlines. Add testimonial slider to homepage. Move pricing table higher on page.
Problem: None of these tests address why 64% of visitors bounce, why 97.2% never add to cart, or why 69% abandon checkout. The team guesses at solutions without diagnosing problems.
Three months later: Five A/B tests run. Two showed slight lifts (3-4%), three showed no statistical difference. Conversion rate unchanged at 2.8%. Traffic continues growing, revenue stays flat.
The analytics gap: Measurement tools show what happened but not why. Visitors bounced—but from which friction point? Checkout abandoned—but at which step, on which device, due to which barrier? Button color tests cannot fix problems the team cannot identify.
CRO analyzers solve this diagnostic gap by identifying specific conversion barriers before testing begins, preventing wasted months testing symptoms instead of causes.
"Without data, you're just another person with an opinion." — W. Edwards Deming
What CRO Analyzers Actually Measure
CRO analyzers differ from analytics platforms through diagnostic specificity. Google Analytics reports aggregate metrics (bounce rate, time on page, conversion rate). CRO analyzers diagnose friction categories explaining why metrics underperform.
Analytics output: Product page bounce rate 68%
CRO analyzer output: Product page bounce driven by three barriers—missing delivery timeframe (affects 82.9% mobile traffic per industry mobile usage data), pricing hidden below fold requiring 2.4 screen scrolls on mobile, trust signals absent near CTA
The distinction: Analytics measures outcomes, analyzers diagnose causes.
Core Analyzer Capabilities
1. Friction categorization
Analyzers classify conversion barriers into diagnostic categories enabling targeted fixes:
Clarity friction: Visitors cannot understand offering, value proposition unclear, next step ambiguous
Trust friction: Insufficient proof, missing guarantees, unclear return policies
Technical friction: Slow load times, mobile breakpoints, JavaScript errors
Flow friction: Too many steps, unexpected detours, form complexity
Standard analytics cannot distinguish between these categories—all manifest as "high bounce rate" or "low conversion." Analyzers pinpoint which friction type blocks progress.
2. Element-level diagnosis
Analyzers identify specific page elements causing friction:
Missing elements: No delivery timeframe near checkout button, pricing information requires scrolling, return policy link absent
Misplaced elements: Trust signals located in footer (below 89% of mobile scroll depth), CTA below fold on 73% of mobile viewports
Confusing elements: Headline fails 5-second comprehension test, button labels ambiguous ("Learn More" vs. "Get Pricing")
This element specificity enables precise fixes. "Add delivery timeframe above checkout button" beats "improve checkout conversion" as actionable guidance.
3. Device-specific friction detection
Research shows 82.9% of landing page traffic comes from mobile devices, yet desktop-focused analysis misses mobile friction entirely. Analyzers diagnose device-specific barriers:
Mobile friction: CTA requires thumb stretch outside comfortable reach zone, form fields trigger wrong keyboard type, images unoptimized causing 6+ second load on 3G
Desktop friction: Multi-column layout creates unclear reading sequence, hover states required but touch users cannot access
Aggregate conversion rate (desktop + mobile combined) masks device-specific problems. Mobile converting at 1.2% while desktop converts at 4.8% requires different diagnostic approach than overall 2.3% rate suggests.
4. Visitor intent matching
Analyzers evaluate whether page content matches visitor search intent:
Informational intent: User searches "what is X" but lands on pricing page pushing immediate purchase
Transactional intent: User searches "buy X" but lands on educational blog requiring navigation to find purchase path
Comparison intent: User searches "X vs Y" but lands on generic product page without comparison context
Intent mismatch drives immediate bounces despite technically accurate page content. Analyzers flag these mismatches; analytics only shows high bounce without explaining cause.
How CRO Analyzers Work: The Diagnostic Process
CRO analyzers follow systematic diagnostic workflow identifying conversion barriers through structured evaluation:
Step 1: Page element inventory
Analyzer catalogs all page components:
Content elements: Headlines, subheadlines, body copy, CTA button labels
Trust elements: Reviews, testimonials, guarantees, security badges, return policies
Technical elements: Load time, mobile responsiveness, JavaScript functionality
Navigation elements: Menu structure, internal links, breadcrumbs, filters
This inventory creates baseline understanding of page composition before diagnosis begins.
Step 2: Friction rule evaluation
Analyzers apply conversion best practice rules identifying violations:
Mobile-first rules:
- Primary CTA visible within first screen on mobile (82.9% of traffic)
- Touch targets minimum 44x44 pixels (prevents misclicks)
- Load time under 3 seconds (53% abandon if slower per research)
Trust signal rules:
- Reviews/ratings within one screen of primary CTA
- Return policy/guarantee accessible before checkout
- Security indicators visible near payment information
Clarity rules:
- Headline passes 5-7 second comprehension test
- Value proposition states specific outcome
- Next action explicit ("Buy Now" vs. vague "Learn More")
Form optimization rules:
- Maximum 4 fields when possible (research shows reducing 11 fields to 4 increases conversions 120%)
- Required fields marked clearly
- Error messages specify exact problem
Each rule violation identified becomes diagnosed friction point requiring fix.
Step 3: Severity scoring
Not all friction equally impacts conversion. Analyzers prioritize fixes by:
Traffic impact: Friction affecting 82.9% of visitors (mobile) outranks desktop-only friction affecting 17.1%
Conversion proximity: Barriers at checkout (late-stage) often have higher dollar impact than homepage friction
Fix complexity: Low-effort, high-impact fixes (add delivery date near button) prioritize above complex rebuilds
This scoring prevents teams from fixing low-impact friction while high-impact barriers remain.
Step 4: Actionable fix specification
Analyzers translate diagnoses into implementable changes:
Vague guidance: "Improve trust signals"
Actionable specification: "Add verified review summary (4.8/5 stars from 1,243 reviews) within one mobile screen of Add to Cart button; position above fold on 320px viewport"
The difference: Developers and designers can implement specific guidance immediately without interpretation ambiguity.
CRO Analyzer Categories: Different Tools, Different Diagnostics
CRO analyzer market includes distinct tool categories optimizing for different diagnostic approaches:
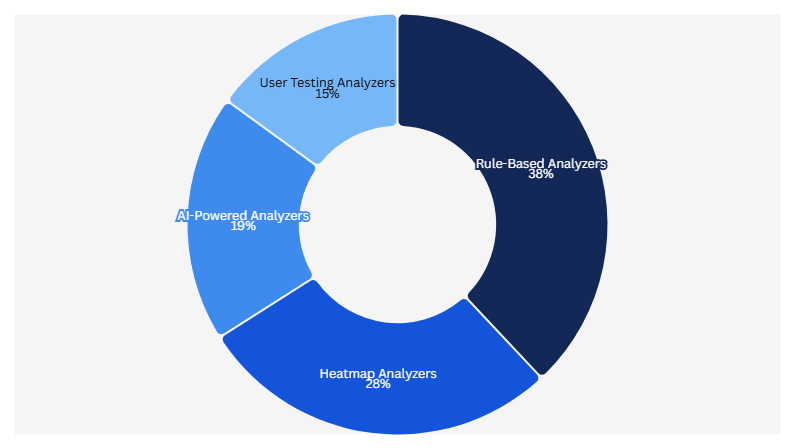
Category 1: Rule-based analyzers
These apply predetermined conversion best practice rules:
Approach: Scan page against 50-200 conversion optimization rules
Output: Scored checklist identifying rule violations
Strength: Comprehensive coverage of known best practices
Weakness: Cannot identify unique friction specific to business model
Example rules applied:
- CTA contrast ratio minimum 4.5:1
- Headline length maximum 7 words
- Trust signals within 300 pixels of primary action
- Mobile load time under 3 seconds
Best for: Teams new to conversion optimization needing structured framework
Category 2: Heatmap analyzers
These combine behavior tracking with friction diagnosis:
Approach: Analyze click patterns, scroll depth, rage clicks
Output: Visual heatmaps highlighting engagement vs. friction zones
Strength: Shows actual user behavior patterns
Weakness: Requires traffic volume for statistical significance
Diagnostic indicators:
- Rage clicks (multiple rapid clicks same element) suggest broken functionality
- Scroll abandonment (majority exit specific page depth) indicates friction point
- Click dispersion (scattered clicks across non-interactive elements) shows confusion
Best for: Sites with 10,000+ monthly sessions providing statistically meaningful behavior data
Category 3: AI-powered analyzers
These use machine learning identifying friction patterns:
Approach: Train models on thousands of conversion-optimized pages
Output: Probabilistic scoring of conversion likelihood plus friction diagnosis
Strength: Identifies non-obvious friction patterns humans miss
Weakness: Requires large training datasets, less transparent reasoning
Pattern detection examples:
- Above-fold CTA placement correlates with 34% higher mobile conversion
- Specific headline structures (outcome + timeframe) correlate with 27% lower bounce
- Trust signal proximity to CTA correlates with 41% higher checkout completion
Best for: Data-driven teams comfortable with probabilistic recommendations
Category 4: User testing analyzers
These combine automated scanning with human feedback:
Approach: Automated rules plus moderated or unmoderated user testing
Output: Friction diagnosis validated by actual user confusion points
Strength: Captures subjective friction automated tools miss
Weakness: Slower, higher cost, requires recruiting test participants
Validation examples:
- Automated tool flags missing pricing; user testing confirms 73% abandon searching for cost
- Automated tool flags CTA below fold; user testing shows 64% never scroll to see it
- Automated tool flags form complexity; user testing reveals specific confusing field labels
Best for: High-value conversion flows (enterprise sales, high-ticket products) justifying testing investment
What CRO Analyzers Detect That Analytics Cannot
Standard analytics platforms (Google Analytics, Adobe Analytics, Heap) excel at measurement but lack diagnostic capabilities CRO analyzers provide:
Gap 1: First-screen friction
Analytics shows: 68% bounce rate on product page
Analytics cannot show: Whether bounce occurred because CTA invisible (below fold on mobile), pricing missing, value proposition unclear, or trust signals absent
CRO analyzer diagnosis: "Primary CTA located 1,847 pixels below fold on mobile (82.9% of traffic); requires 2.7 screen scrolls to reach. Pricing information absent above fold. No trust signals (reviews, guarantees) visible in first screen. Headline fails 5-second comprehension test (0% of test participants could restate offer)."
The difference enables targeted fix: Move CTA above fold, add pricing, position trust signals, rewrite headline. Analytics alone provides no fix direction.
Gap 2: Form field friction
Analytics shows: 42% abandon checkout form
Analytics cannot show: Which specific fields cause abandonment or why
CRO analyzer diagnosis: "Shipping address field shows 67% abandonment rate. Session recordings reveal users hesitate average 8.4 seconds before abandoning (suggesting calculation of shipping cost concern, not form complexity). Checkout contains 11 total fields."
Research confirms reducing form fields from 11 to 4 increases conversions by 120%. But analytics cannot identify which 7 fields to remove. Analyzer showing shipping field drives most abandonment enables testing checkout without shipping calculation vs. with.
Gap 3: Mobile-specific barriers
Analytics shows: Mobile conversion 1.8%, desktop conversion 4.2%
Analytics cannot show: Which mobile-specific friction causes gap
CRO analyzer diagnosis: "Mobile CTA requires horizontal thumb stretch 76mm from natural resting position (exceeds comfortable 63mm reach zone). Touch target measures 38x38 pixels (below recommended 44x44 minimum). Page weight 4.2MB causing 7.8 second load on median mobile connection. Research shows 53% of mobile visitors abandon sites loading over 3 seconds."
Mobile traffic represents 82.9% of landing page visits per industry data, meaning mobile friction impacts majority of revenue opportunity. Standard analytics shows conversion gap but not fixable causes.
Gap 4: Trust deficit friction
Analytics shows: Add-to-cart rate 3.1%
Analytics cannot show: Whether low rate stems from pricing concerns, product doubts, or missing proof
CRO analyzer diagnosis: "Zero customer reviews visible above fold. Guarantee information located in footer (below 94% scroll depth). No delivery timeframe mentioned near Add to Cart button. Security badges absent near checkout entry."
Trust friction requires proof element additions, not layout changes or copy tweaks. Analytics measuring aggregate conversion cannot distinguish trust friction from other barrier types.
The Diagnostic Workflow: Analyzer to Fix to Test
CRO analyzers fit specific position in conversion optimization workflow:
Traditional workflow (analytics-driven)
Step 1: Review analytics, see low conversion
Step 2: Brainstorm test ideas based on opinions
Step 3: Run A/B tests hoping for lift
Step 4: Most tests show no significant difference
Step 5: Repeat with new random ideas
Time to impact: 6-12 months cycling through random tests
Success rate: 10-20% of tests produce meaningful lift
Analyzer-driven workflow
Step 1: Run CRO analyzer identifying specific friction points
Step 2: Prioritize fixes by traffic impact and complexity
Step 3: Implement fixes addressing diagnosed barriers
Step 4: A/B test fixes against control
Step 5: Measure impact, iterate on next friction point
Time to impact: 2-4 weeks for first fix, systematic improvement cycle
Success rate: 60-70% of tests produce lift (because testing addresses diagnosed problems)
The efficiency difference compounds over time. Traditional approach testing 20 random ideas might yield 3-4 improvements over 18 months. Analyzer approach testing 20 diagnosed friction points yields 12-14 improvements in same timeframe.
CRO Analyzer Limitations and When Analysis Fails
Analyzers provide diagnostic value but cannot solve all conversion challenges:
Limitation 1: Cannot diagnose offering problems
Analyzer detects: All conversion best practices followed—clear value prop, trust signals present, fast load time, mobile optimized
Analyzer cannot detect: Product overpriced relative to alternatives, market lacks demand, offering solves wrong problem
Conversion optimization cannot fix fundamental product-market fit issues. If offering invalid, perfect execution still converts poorly.
Limitation 2: Requires implementation discipline
Analyzer output: Prioritized list of 47 friction points
Team reality: Developer bandwidth for 2 fixes monthly
Analyzer value depends on implementation speed. Identifying 47 problems but fixing 2 quarterly means 5+ years to address all friction. Diagnostic speed must match implementation capacity.
Limitation 3: Static analysis misses behavior patterns
Analyzer diagnosis: Form appears optimized (4 fields, clear labels, mobile responsive)
Actual behavior: Users abandon because they lack information required to complete fields (account number, policy ID)
Analyzers evaluate page elements but cannot always predict information availability barriers. Behavioral analytics (session recordings, user testing) catch friction static analysis misses.
Limitation 4: Cannot predict test results
Analyzer identifies: CTA below fold on mobile, likely impacting conversion
Test result: Moving CTA above fold decreases conversion 8%
Analyzers diagnose probable friction but cannot guarantee fix direction. Systematic testing remains essential validating diagnosis-driven changes.
How BluePing Functions as CRO Analyzer
BluePing applies CRO analyzer principles diagnosing conversion friction before testing:
Analyzer input: Live product page or checkout flow URL
Diagnostic process: Evaluates mobile-first friction (82.9% traffic), clarity barriers, trust signal gaps, technical performance
Output: Specific friction points prioritized by traffic impact
Example diagnosis:
"Mobile CTA positioned 2,847 pixels below fold (requires 3.4 screen scrolls). Product page missing delivery timeframe near purchase button (affects 82.9% mobile traffic). Page weight 5.2MB causing 9.1 second mobile load (53% abandon sites loading over 3 seconds per research). No customer reviews visible above fold."
Each identified friction point includes fix specification: "Position primary CTA within first mobile screen (0-667 pixels on 375px viewport). Add delivery estimate 'Ships tomorrow, arrives Tuesday' within one screen of CTA. Optimize images reducing page weight to under 2MB. Add review summary showing aggregate rating within first screen."
This diagnostic specificity enables teams to fix identified barriers immediately rather than cycling through random test ideas hoping for improvement.
.png)

.png)