

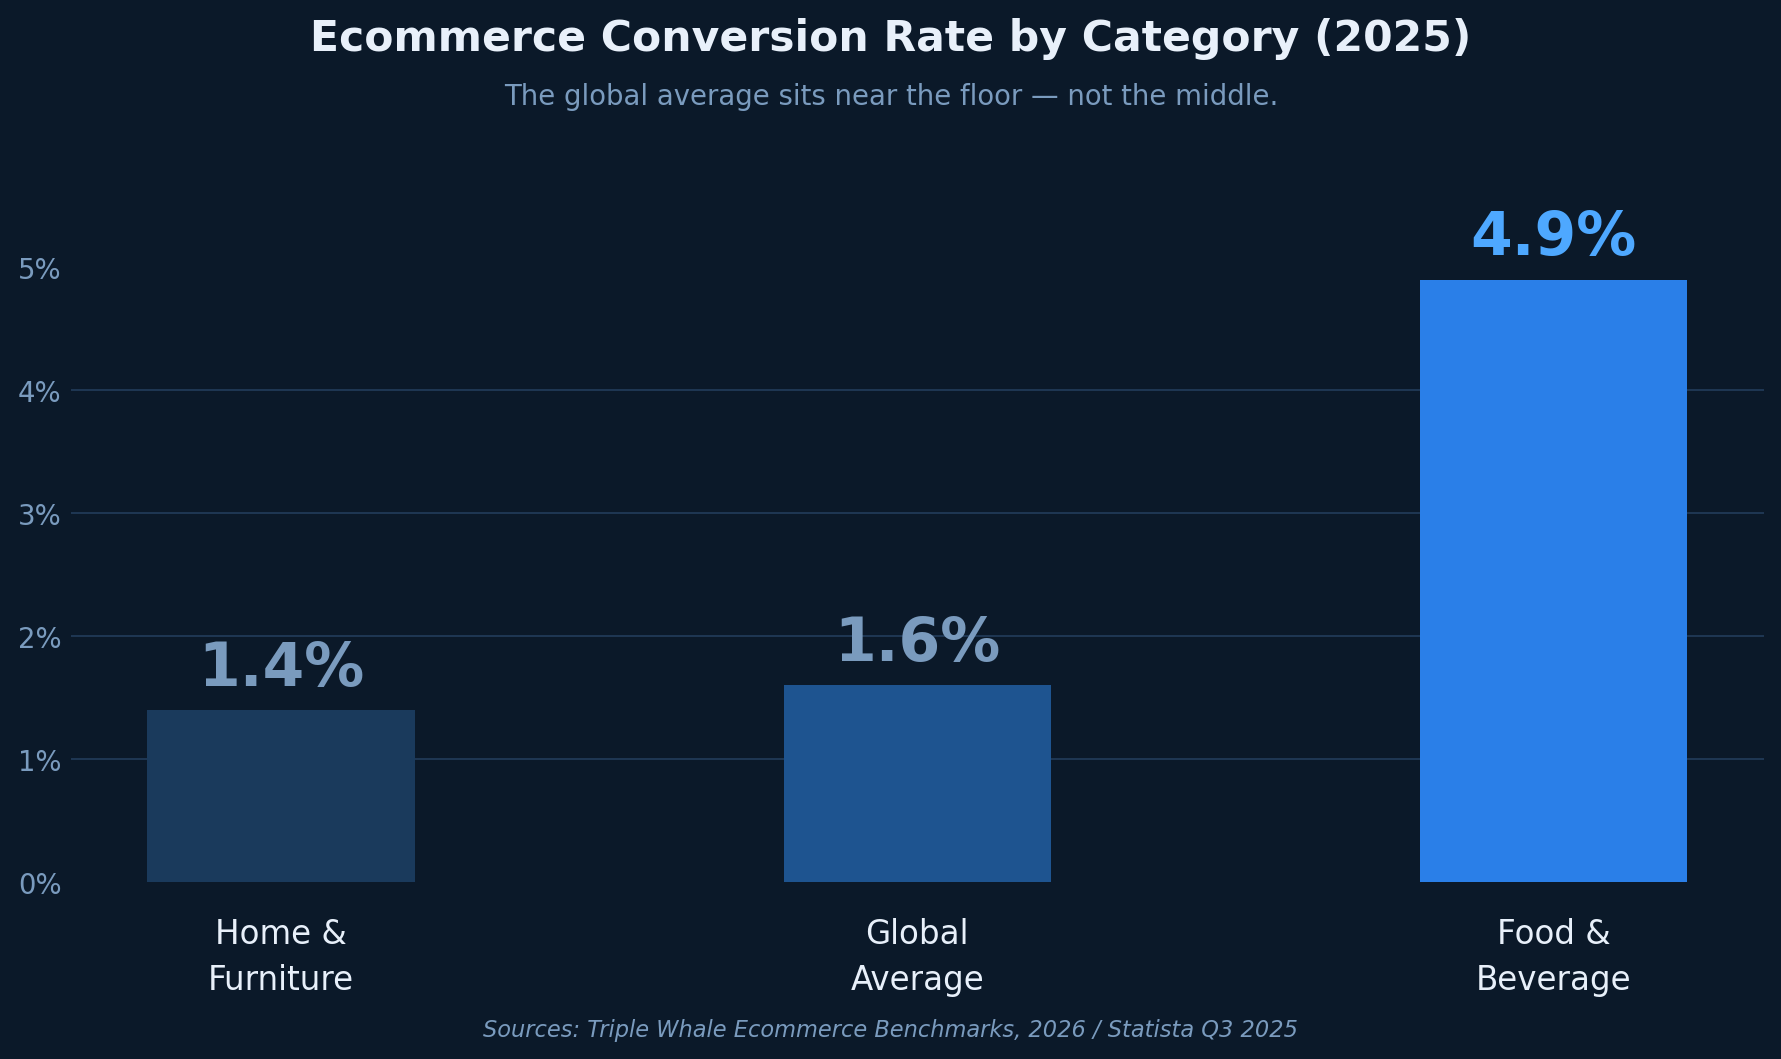
Your store converts at 1.6%. The global ecommerce average, according to Statista's Q3 2025 data, is also 1.6%. Which means you're exactly average, and exactly average in ecommerce means 98 out of every 100 visitors leave without buying.
The gap between 1.6% and the top-performing Food & Beverage stores at 4.9% isn't a traffic problem. It isn't a product problem. It's almost always a friction problem, and friction lives in specific places on specific pages that most store owners haven't identified yet.
That's the real issue with how ecommerce stores approach CRO tools. They buy a platform before they know which problem they're trying to solve. A heatmap on the wrong page. An A/B test with no real hypothesis. Session recordings nobody has time to watch. The data piles up. The conversion rate doesn't move.
Talia Wolf, founder of GetUplift and one of the most widely cited ecommerce CRO practitioners, put it plainly in an interview: "Unfortunately, most people just guess. They look for a leak in their sales funnel and try to fix it. But you really need a structured process and methodology to optimize the entire funnel and web site."
This guide gives you that structure, matching the best CRO tools for ecommerce directly to the specific problems they're built to solve.
What Is the CRO Tool for Ecommerce? (It Depends on the Problem)
There is no single best CRO tool for ecommerce. There are tools for different stages of the optimization process, and using them out of sequence is the most common reason ecommerce stores invest in CRO without seeing results.
The four categories ecommerce stores need, in the order they're most useful, are analytics tools for identifying where the funnel breaks, behavior and heatmap tools for understanding how shoppers interact with specific pages, session recording tools for watching individual shopper journeys, and A/B testing platforms for validating a specific fix once you know what to test. Before any of these, there is a fifth category almost every ecommerce store skips: the diagnostic tool that tells you what's broken before you buy anything else.
Tools for Understanding Where Traffic Drops Off
What problem this solves: You have traffic across multiple pages but don't know which specific point in your funnel is bleeding customers.
Analytics tools give you the macro view of your store's performance, covering funnel visualizations, exit pages, traffic source performance, and conversion paths. For ecommerce, this means identifying whether your product pages are the problem, your cart, your checkout, or something earlier in the journey entirely.
Google Analytics 4 is the default starting point for most stores, particularly those on Shopify, WooCommerce, or Magento, where native integrations exist. Mixpanel and Amplitude serve stores that need deeper event-level tracking, useful when you want to understand sequences of behavior rather than just page-level metrics.
When to use it: Before anything else. If you don't know where your funnel is losing visitors, you have no starting point for optimization. A heatmap on the wrong page is wasted effort.
What it doesn't tell you: Why visitors are leaving, what they're looking at, or what specific elements are creating friction. That requires the next category.
Tools for Diagnosing Product Page and Checkout Friction
What problem this solves: You've identified a high-exit page, often a product page or checkout step, and need to understand how shoppers are engaging with it.
Heatmap tools generate visual overlays of where shoppers click, where they scroll, and where their attention concentrates. For ecommerce this is especially valuable on product pages, where the placement of add-to-cart buttons, image galleries, reviews, and pricing all directly affect purchase decisions.
Hotjar is the most widely used tool in this category, offering click maps, scroll maps, and attention heatmaps alongside session recordings. Microsoft Clarity is a strong free alternative with comparable core features. Crazy Egg suits stores that want to run simple A/B tests alongside heatmap analysis without adding a separate platform.
The checkout page is where heatmap data becomes particularly revealing. Baymard Institute's research across 49 studies confirms a 70.19% global cart abandonment rate, and 48% of those abandonments stem from unexpected costs appearing at checkout. A heatmap showing shoppers consistently hovering over a shipping cost field before dropping off is exactly the kind of diagnostic signal this category is built to surface.
When to use it: After analytics has identified your problem page. Heatmaps are most useful when you already know where the leak is and want to form a specific hypothesis about what's causing it.
What it doesn't tell you: The individual story of a specific shopper's experience. For that, session recording is the complement.
Tools for Watching Real Shoppers in Real Sessions
What problem this solves: You've identified friction on a specific page but want to observe how individual shoppers actually experience it, beyond what aggregated pattern data can show.
Session recording tools capture individual visits as video replays. Watching a shopper scroll past your size guide three times, attempt to tap an add-to-cart button that isn't responding properly on mobile, and abandon tells you something a click map can't: the full sequence of confusion leading to the exit.
FullStory and LogRocket are the leading tools in this category for mid-to-enterprise ecommerce. For smaller Shopify stores, Hotjar's built-in session recording or Lucky Orange both provide solid coverage without requiring a separate platform.
Mobile is where session recording earns its keep most quickly in ecommerce. Statista data cited by Shopify shows smartphones accounted for approximately 78% of retail site visits worldwide in Q3 2025. Watching session replays of mobile shoppers specifically, where checkout friction, small tap targets, and form field issues are amplified, routinely reveals problems that desktop testing misses entirely.
When to use it: Alongside or after heatmap analysis on your identified problem pages. The value compounds when you review 30 to 50 sessions to find repeating patterns, not just isolated edge cases.
What it doesn't tell you: Whether a specific change will actually improve your conversion rate. That requires testing.
Tools for Testing Changes Before You Roll Them Out
What problem this solves: You have a specific hypothesis backed by behavioral data and want to validate whether a change improves a defined metric before applying it site-wide.
A/B testing platforms serve one function: telling you whether version B of a specific element performs better than version A for a defined segment of traffic, with statistical confidence. For ecommerce the most common tests run on product page layouts, CTA copy and placement, checkout flow sequence, pricing presentation, and trust signal positioning.
VWO and Optimizely handle mid-market to enterprise ecommerce needs with robust segmentation and multivariate testing capabilities. For Shopify stores specifically, Convert and AB Tasty integrate cleanly within the Shopify ecosystem. Smaller stores often start with Google Optimize alternatives or Shopify's native A/B capabilities built into certain themes.
The critical limitation of this category remains the same regardless of platform: A/B testing is only as good as the hypothesis behind it. Baymard Institute's research suggests the average large ecommerce site has 39 potential areas for checkout improvement, and better checkout design alone could recover an estimated $260 billion in lost orders across US and EU ecommerce sales. The question isn't whether there's something to test. It's knowing which of those 39 areas to test first. That requires a diagnostic, not a testing platform.
When to use it: After you have a well-formed hypothesis grounded in behavioral data. Testing randomly wastes traffic and produces results that are hard to act on.
The Tool Most Ecommerce Stores Skip But Shouldn't
What problem this solves: You don't yet know which pages have conversion barriers, which categories of friction are affecting your store most, or where to direct any of the tools above.
Diagnostic and audit tools scan your store pages and surface conversion barriers across the specific categories that matter for ecommerce: checkout friction, trust signals, value proposition clarity, product page structure, and on-page SEO performance. Unlike analytics, they don't require large traffic volumes to produce actionable findings. Unlike heatmaps, they don't require you to already know which page is the problem. Unlike A/B testing platforms, they don't require a pre-formed hypothesis.
They answer the question every other tool assumes you've already answered: what specifically is broken on this page, and why is it likely costing you conversions?
BluePing is a website conversion diagnostic built specifically for this stage. It scans a URL in approximately 30 seconds and delivers a structured report covering 19 conversion rules across SaaS, ecommerce, and SEO categories, including checkout friction, trust and social proof gaps, value proposition clarity, and on-page SEO signals that affect both organic visibility and post-arrival behavior. The output is evidence-backed, prioritized, and specific to the page you scan.
For an ecommerce store that hasn't yet run any structured optimization work, BluePing answers the single most important question first: what is actually stopping shoppers from converting on this specific page, before you spend a dollar on any subscription tool?
How to Pick the Right Tool for Your Store Right Now
If your store has never done structured CRO work, run a diagnostic scan on your highest-traffic product page and your checkout page before adding anything else to your stack. Understand what's broken first.
If you know which pages have a problem but don't know what's causing it, layer in analytics plus a heatmap tool together. Quantify the scale of the drop-off and observe the behavior pattern.
If you've identified a behavior pattern and formed a specific hypothesis, that's when an A/B testing platform earns its subscription fee. Use it to validate the specific change, not to fish for improvements.
The spread in ecommerce conversion rates, from 1.4% for home goods to 4.9% for food and beverage according to Triple Whale, reflects real differences in purchase intent and product type. But within any category, the stores at the top of that range got there by diagnosing problems systematically, not by assembling the largest tool stack.
Pick the tool that answers the question you're actually trying to answer right now.
Not sure what's stopping visitors from buying on your key pages? BluePing scans any URL in about 30 seconds and surfaces conversion barriers across checkout friction, trust signals, value proposition clarity, and on-page SEO.


.png)