
.png)
A conversion rate is a number. What it doesn't tell you is why that number is what it is, where in the journey visitors are dropping off, which traffic sources are sending people who actually buy, or what specific elements on the page are killing the deal.
Conversion analysis tools exist to answer those questions — but they don't all answer the same one. Buying the wrong type of tool for the question you're trying to answer is the most consistent reason businesses end up with dashboards full of data and no clear path forward.
This guide maps the four categories of conversion analysis tools to the specific analytical questions they're built to answer, so you can build a stack that actually moves your conversion rate rather than just monitoring it.
What Does "Analyzing Conversion Data" Actually Mean?
Avinash Kaushik, co-founder of Market Motive and long-time Digital Marketing Evangelist at Google, framed the core challenge clearly in his Occam's Razor blog: "Regardless of the type of site it all comes down to your ability to identify your macro and micro conversions, and then compute the economic value. I'm calling them conversions, but they are better thought of as 'business outcomes.'"
That reframing matters because most businesses treat conversion analysis as a single activity when it's actually four different activities happening at four different levels of the funnel. Web analytics answers where the funnel breaks. Attribution tools answer which sources drive real outcomes. Behavioral tools answer why specific pages underperform. Diagnostic tools answer what barriers exist in the first place.
Each category requires a different tool, produces different data, and answers a different business question. According to Digital Applied's 2026 conversion rate benchmark report, the median website conversion rate sits at 2.35% while top performers reach 11.45%. That nearly fivefold gap between median and top-decile performance is almost never a traffic problem. It's an analysis problem: most businesses aren't looking at their conversion data at the right level of granularity to find what's holding them back.
Category 1 — Web Analytics Tools: Where Is the Funnel Breaking?
Web analytics tools are the starting point for conversion data analysis. They tell you where in the funnel visitors are dropping off, which pages have the highest exit rates, how different traffic sources behave differently through the purchase path, and where the volume-weighted opportunity for improvement is largest.
Google Analytics 4 is the default tool in this category and the most widely used starting point for conversion funnel analysis. Its Funnel Exploration reports allow teams to define custom funnel steps using any tracked event, providing a clear view of drop-off rates between each stage of the conversion path. Mixpanel and Amplitude serve teams that need deeper behavioral event tracking alongside funnel analysis, particularly useful for SaaS products where the conversion path involves multiple in-product actions before a paid upgrade.
Andy Crestodina, Co-Founder and CMO of Orbit Media Studios, made the case for granular funnel analysis in a LinkedIn post that captures exactly why surface-level analytics are insufficient: "LOTS of marketers measure conversion rates. SOME marketers measure conversion rate per landing page. VERY FEW marketers measure conversion rate per landing page by mobile and desktop. But that is exactly the report that shows your lowest performers."
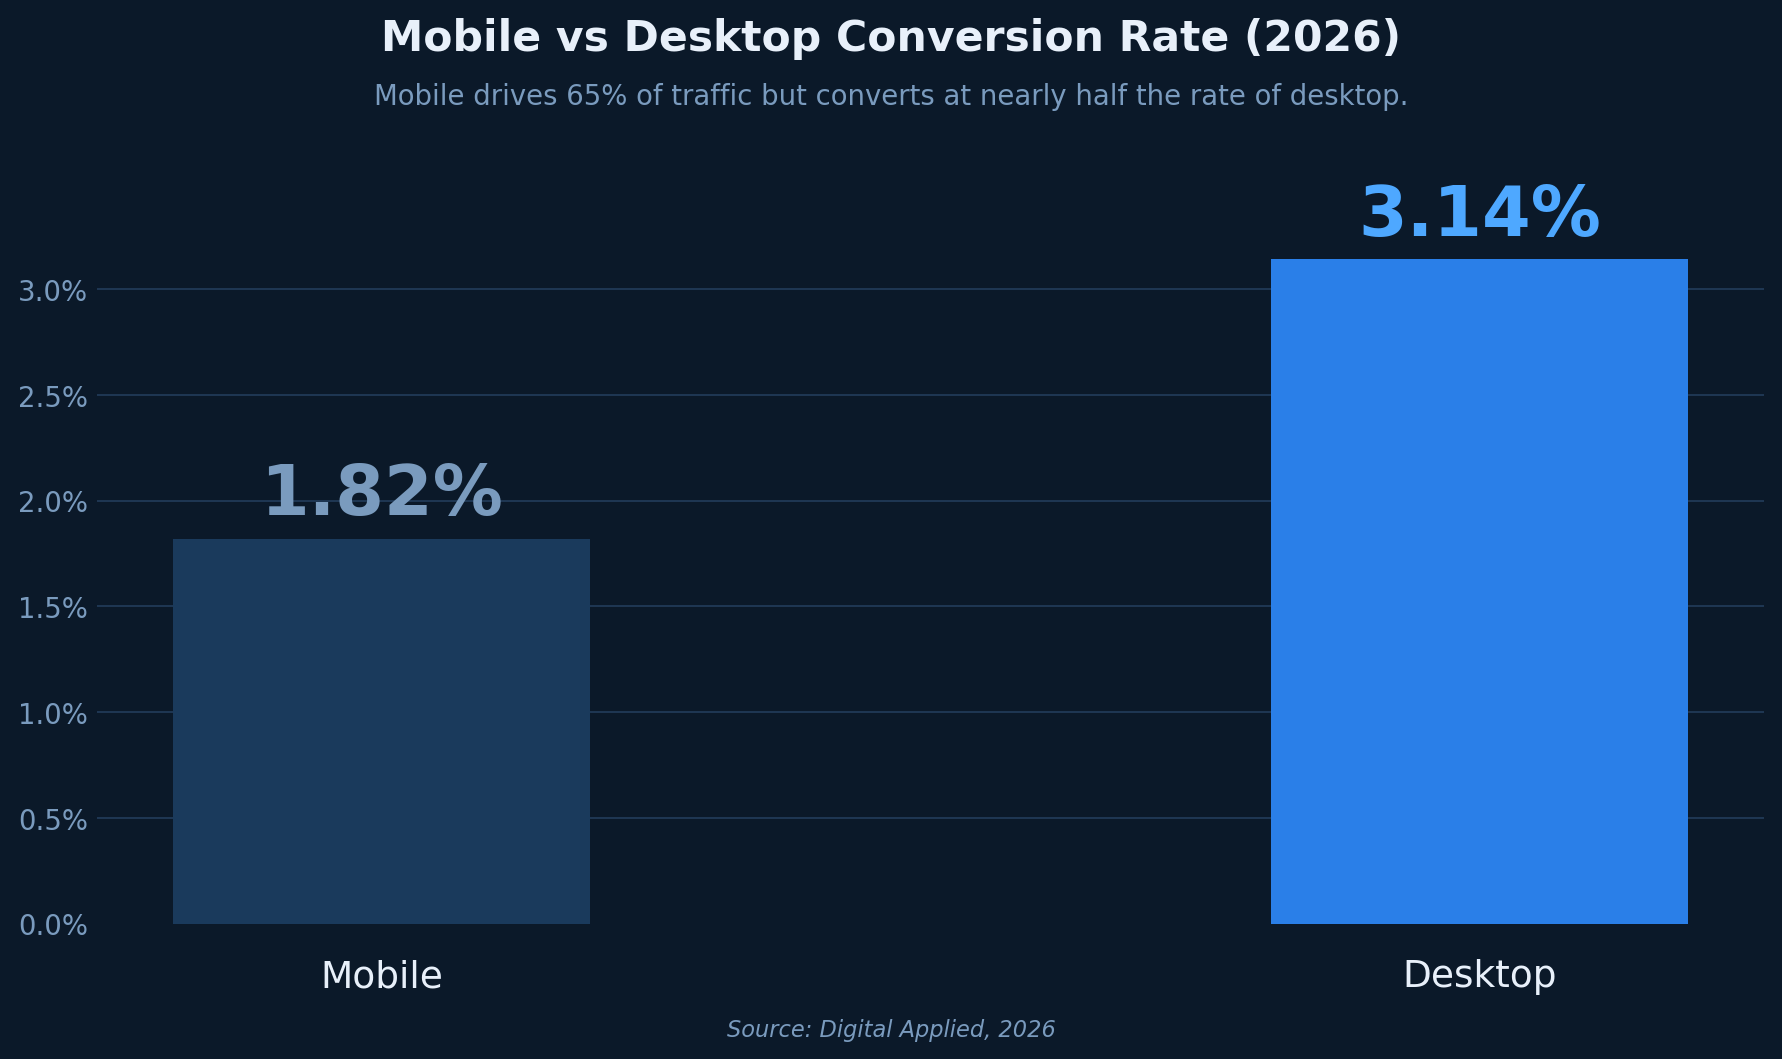
The mobile-desktop conversion gap makes this segmentation urgent. According to Digital Applied's 2026 benchmarks, mobile accounts for 65% of all website traffic but converts at only 1.82% compared to desktop's 3.14%, a 42% gap. A site-wide conversion rate hides that gap entirely. Web analytics tools that allow device-level funnel segmentation surface problems that aggregate reporting will never reveal.
What web analytics tools don't answer: They tell you where the drop-off is happening but not why. For that, behavioral data tools are necessary.
Category 2 — Attribution Tools: Which Sources Are Driving Real Conversions?
Attribution tools answer a fundamentally different question: not where visitors drop off, but which marketing touchpoints actually caused the conversions that did happen. This distinction is especially important for businesses running paid traffic across multiple channels simultaneously.
According to a 2023 study by MMA Global, cited by Funnel.io in their 2025 attribution guide, 50% of companies now use multi-touch attribution as part of their marketing strategy. The adoption reflects a growing recognition that last-click attribution, which credits the final touchpoint before conversion with 100% of the outcome, systematically misrepresents how buyers actually make decisions.
Multi-touch attribution tools including Rockerbox, Triple Whale, and Northbeam distribute conversion credit across the full sequence of touchpoints a visitor interacted with before converting. For ecommerce businesses specifically, this typically reveals that channels driving awareness and early consideration — organic search, content, and social discovery — contribute far more to final conversions than last-click models suggest.
GA4's native attribution modeling now includes a data-driven option that uses machine learning to distribute credit based on actual observed behavior rather than positional assumptions. For most mid-market businesses, this represents a meaningful improvement over manual attribution model selection.
What attribution tools don't answer: They explain which channels send converting visitors but not what on the page or in the experience is causing non-converting visitors to leave. Behavioral tools answer that.
Category 3 — Behavioral Analysis Tools: Why Aren't Visitors Converting on This Page?
Behavioral analysis tools provide the qualitative layer that quantitative funnel data cannot. They record how individual visitors interact with specific pages — where they click, how far they scroll, where they hesitate, where they rage-click on non-interactive elements, and the full sequence of behavior leading to an exit or a conversion.
Hotjar remains the most widely deployed tool in this category, offering heatmaps, scroll maps, session recordings, and on-site surveys within a single platform. Microsoft Clarity provides comparable core functionality at no cost, making it particularly accessible for smaller sites. FullStory and LogRocket serve larger engineering and product teams that need pixel-perfect session replays tied to technical event data.
The value of session recordings specifically comes from pattern recognition across many sessions. Watching a single recording reveals one visitor's experience. Watching fifty recordings from users who abandoned the same page and identifying the repeating behaviors they share reveals a structural friction problem worth acting on.
Behavioral tools are strongest when applied to pages already identified as problem areas through web analytics. Running heatmap analysis across an entire site without first knowing which pages have meaningful exit rate problems wastes both tool capability and analyst time.
What behavioral tools don't answer: They show how friction manifests but they require a hypothesis about which pages to examine. Without knowing where to look first, behavioral analysis can become a time-intensive process of watching replays without direction.
Category 4 — Diagnostic Tools: What Barriers Exist Before You Start Analyzing?
Diagnostic tools occupy a distinct position in the conversion analysis stack. Rather than requiring traffic data, heatmap volume, or a pre-existing hypothesis about which page has a problem, diagnostic tools scan a URL and surface conversion barriers directly.
This makes them most valuable at the beginning of the analysis process, before you have enough data from the other three categories to form reliable hypotheses. For a business launching a new landing page, entering a new traffic channel, or simply unsure which pages to prioritize, a diagnostic tool answers the first question the other tools all assume you've already answered: what is actually broken on this page right now?
BluePing is a website conversion diagnostic built for this use case. It scans a URL in approximately 30 seconds and produces a structured report covering 19 conversion rules across ecommerce, SaaS, and SEO categories, including trust signal gaps, value proposition clarity, checkout friction, and on-page SEO health. The output is prioritized by likely impact, giving teams a starting point for both behavioral analysis and A/B test hypothesis formation without requiring traffic volume or extended data collection periods.
What diagnostic tools don't answer: They identify barrier categories and priorities but not the precise behavioral manifestation of each barrier at the individual session level. That's what behavioral tools are for.
How to Build a Conversion Analysis Stack That Works
A functional conversion analysis stack doesn't require all four categories simultaneously. It requires the right category for the question you're currently trying to answer.
Web analytics tools belong in every stack from the beginning. GA4 specifically is free, integrates natively with Google Ads and Search Console, and provides the funnel data necessary to prioritize which pages deserve deeper investigation. There is no scenario where a business doing any meaningful volume of digital traffic should lack basic funnel visibility.
Attribution tools become relevant once a business is running paid traffic across more than one channel. If all traffic comes from a single source, attribution is straightforward. As channels multiply, last-click attribution increasingly misrepresents where conversion credit belongs, and a multi-touch solution starts paying for itself.
Behavioral tools earn their subscription once web analytics has identified specific pages with meaningful exit rate problems. The correct use of a heatmap tool is to investigate a page you already know is underperforming, not to audit your entire site hoping to discover something interesting.
Diagnostic tools are most valuable before the others. Running a diagnostic on a page before you invest time in heatmap analysis or session recording work tells you what categories of barriers are likely present, which pages to prioritize, and what hypotheses to form before opening any other tool.
The Sequence That Produces Actionable Data
The businesses with the highest conversion rates aren't those with the most tools. They're those who use each tool in the right order for the right question.
Start with a diagnostic scan on your highest-traffic and highest-revenue pages. Understand what barriers the evidence-based analysis surfaces. Use web analytics to quantify the scale of each problem in traffic and revenue terms. Apply behavioral tools to the specific pages where the combination of barrier evidence and traffic volume makes investigation worthwhile. Use attribution tools to ensure that the traffic you're optimizing for is the traffic that actually converts.
That sequence turns conversion analysis from a reporting activity into an optimization engine. Without it, the tools generate data. With it, the data generates decisions.
Not sure which of your pages has the biggest conversion problems? BluePing scans any URL in about 30 seconds and surfaces conversion barriers across trust signals, checkout friction, value proposition clarity, and on-page SEO.

.png)
.png)