
.png)
Six months after a $15,000 WordPress website redesign, conversion rate sits at 1.4%—lower than the old site's 1.8%. The new design looks professional, loads reasonably fast on desktop, includes all requested features. Yet visitors abandon at higher rates because WordPress-specific design decisions created invisible conversion barriers.
The agency delivered technically: WordPress installed, theme customized, plugins configured. What they didn't address: how WordPress's default behaviors and common design patterns systematically block conversion when implemented without conversion diagnosis.
Research analyzing landing page performance shows the median conversion rate across industries is 6.6%, yet 48% of website visitors exit the main landing page without any further interaction. WordPress sites face additional conversion challenges from platform-specific design mistakes compounding general conversion barriers.
The framework below identifies WordPress design mistakes preventing conversion—structural flaws requiring fixes before optimization testing produces meaningful results.
"Good design is obvious. Great design is transparent." — Joe Sparano
Why WordPress Design Mistakes Kill Conversion Differently
WordPress powers 43% of all websites globally. This ubiquity creates unique conversion problems:
Standard WordPress patterns optimize for:
- Content management ease (editor experience)
- Feature flexibility (plugin compatibility)
- Visual aesthetics (theme showcase quality)
- Developer convenience (modular architecture)
Conversion-focused design requires:
- Visitor comprehension speed (5-second value clarity)
- Decision pathway clarity (linear progression to CTA)
- Mobile-first performance (82.9% of traffic)
- Friction elimination (every click costs conversions)
The mismatch: WordPress defaults prioritize management convenience over visitor conversion. Most agencies customize aesthetics while preserving conversion-killing structural defaults.
The Seven WordPress Design Mistakes Blocking Conversion
Mistake 1: Homepage Slider Blocking Value Proposition
The mistake: Homepage hero section uses WordPress slider plugin showing 4-6 rotating slides. Primary value proposition appears on slide 2 or 3. 68% of visitors never see it.
Why it kills conversion: Research shows bounce probability increases 32% as page load time goes from 1 second to 3 seconds. Sliders add load time while hiding value propositions. Visitors seeing generic slide 1 ("Welcome to Our Company") bounce before slider rotates to value proposition slide.
WordPress-specific cause: Popular slider plugins (Revolution Slider, LayerSlider, Slider Revolution) marketed on visual effects, not conversion performance. Agencies install them for "professional look" without testing conversion impact.
How to diagnose:
- Heatmap showing which slides receive attention
- Scroll depth analysis (do visitors wait for rotation?)
- Session recordings filtered for <10 second visits
- Bounce rate correlation with slider speed
Example: B2B SaaS homepage: slide 1 shows office photo with "Innovative Solutions", slide 2 shows value proposition "Reduce Data Entry 75% Without Process Changes", slide 3 shows customer logos. 74% bounce before slide 2 displays.
Slider removed, slide 2 content made static hero: bounce drops 74% → 38%.
Analysis of landing page elements shows 76.8% of marketers overlook social proof positioning despite documented effectiveness. Slider rotation makes strategic positioning impossible—by the time trust signals cycle into view after several automatic rotations, most visitors already bounced.
Mistake 2: Mobile Menu Hiding Primary CTA
The mistake: Mobile navigation collapses into hamburger menu. Primary CTA button moves inside collapsed menu. Mobile visitors (82.9% of traffic) can't see conversion action.
Why it kills conversion: Research shows 53% of mobile visitors abandon if page takes longer than 3 seconds to load, and 47% expect pages to load in 2 seconds or less. But speed doesn't matter if CTA is invisible. Mobile visitors scroll, search for action step, abandon when they can't find it.
WordPress-specific cause: Desktop-first theme design. Menu looks professional on designer's desktop screen (1920px wide), breaks conversion flow on mobile (375px wide). Responsive CSS hides CTA maintaining desktop visual hierarchy.
How to diagnose:
- Mobile vs desktop conversion rate comparison (mobile underperforming >40% suggests layout issues)
- Mobile heatmaps showing attention patterns
- Session recordings filtered by mobile device
- CTA click rate segmented by device
Example: Professional services site: desktop conversion 4.2%, mobile conversion 0.9%. Desktop CTA visible above fold. Mobile CTA inside hamburger menu requiring two taps to reach.
Mobile redesign adds sticky CTA button, keeps hamburger menu for navigation: mobile conversion improves 0.9% → 2.8%.
Additional data shows mobile visitors account for 82.9% of landing page traffic compared to only 17.1% desktop. Hiding CTA from 82.9% of visitors guarantees conversion failure regardless of other optimizations.
Mistake 3: Plugin Bloat Destroying Mobile Performance
The mistake: WordPress site runs 25-40 plugins. Each adds JavaScript and CSS loading on every page. Mobile load time: 8-12 seconds. Desktop load time: 3-4 seconds.
Why it kills conversion: Research demonstrates clear performance-conversion correlation:
- Website conversion rates drop by an average of 4.42% for each additional second of load time between 0-5 seconds
- For every second delay in mobile page load, conversions can fall by up to 20%
- A 1 second delay in page load time causes conversion rates to drop by 7%
8-second mobile load time means 35-56% conversion loss before visitor sees content.
WordPress-specific cause: Plugin ecosystem encourages "there's a plugin for that" approach. Each plugin built independently. No optimization for combined loading. Common bloat sources:
- 3-5 SEO plugins (Yoast + Rank Math + All in One SEO installed simultaneously)
- 2-4 form builders (Contact Form 7 + Gravity Forms + WPForms)
- Multiple caching plugins conflicting
- Page builder + theme + customizer all loading styles
How to diagnose:
- GTmetrix / PageSpeed Insights mobile scores
- Plugin performance profiler showing load time by plugin
- Waterfall analysis revealing render-blocking resources
- Conversion rate correlation with page weight
Example: Ecommerce site running 38 plugins. Mobile load time 9.2 seconds. Mobile conversion 0.6%. Audit reveals 19 plugins unused, 8 plugins duplicating functionality.
Plugin reduction to 11 essential plugins, load time drops to 2.8 seconds: mobile conversion improves 0.6% to 2.4%.
Research shows 70% of consumers say page speed impacts their willingness to buy from an online retailer. WordPress plugin bloat directly contradicts this buyer expectation.
Mistake 4: Contact Form 7 Creating Unnecessary Friction
The mistake: Contact Form 7 default implementation requests: Name (first + last separate fields), Email, Phone, Company, Message, plus CAPTCHA. Form completion rate: 12%.
Why it kills conversion: Research on form optimization shows reducing forms from 11 fields down to 4 fields yielded a 120% increase in conversions. Survey data indicates 30.7% of marketers believe four form questions is the ideal number for best conversion rates.
Contact Form 7 defaults encourage field proliferation—easy to add fields, no built-in conversion guidance. Each unnecessary field reduces completions 3-5%.
WordPress-specific cause: Contact Form 7 is free, has 5+ million active installations, appears in every "best WordPress plugins" list. Agencies install it, add standard business form fields, never test conversion impact. Plugin simplicity enables complexity—adding fields requires one line of code.
How to diagnose:
- Form analytics showing field-level abandonment
- Completion rate analysis (starts vs submits)
- Session recordings showing hesitation patterns
- A/B test removing fields sequentially
Example: Lead generation form: Name (first), Name (last), Email, Phone, Company Name, Company Size dropdown, Industry dropdown, How did you hear about us, Message, CAPTCHA. Start rate 34%, completion rate 11%.
Form reduced to: Name, Email, Message: completion jumps to 28%. Follow-up email requests additional qualification data from engaged leads.
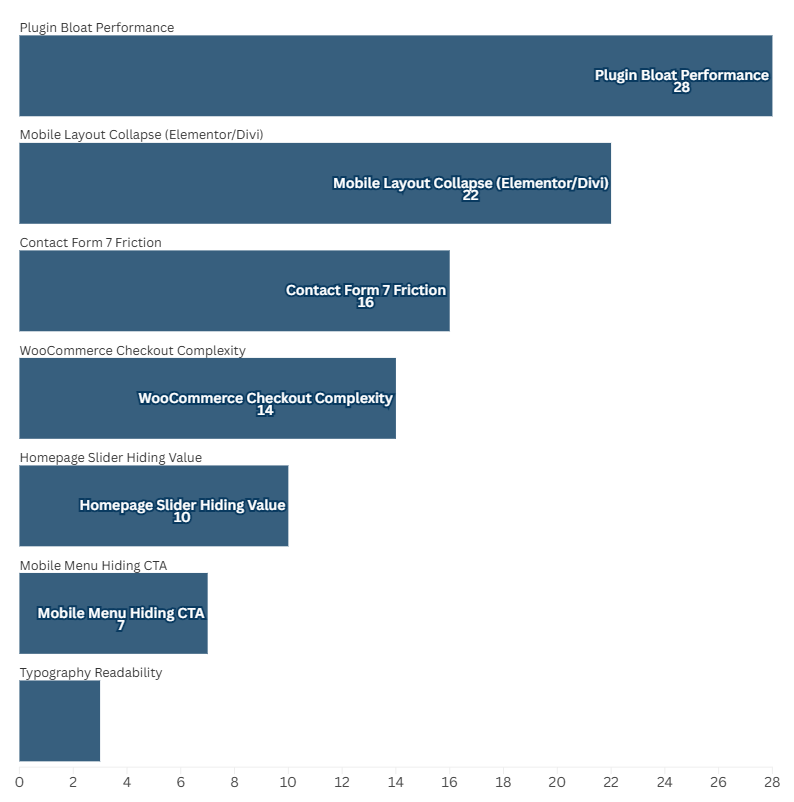
Mistake 5: Elementor / Divi Builder Creating Mobile Layout Collapse
The mistake: Page builder designs perfect desktop layouts with complex column structures (4 columns, nested sections, sidebar widgets). Mobile version stacks everything vertically pushing CTA 4-5 screens below fold.
Why it kills conversion: Page builders optimize desktop visual appeal. Mobile responsive behavior stacks columns linearly. Desktop layout: value proposition + benefits + CTA all visible simultaneously. Mobile layout: value proposition screen 1, benefits screen 2-3, CTA screen 4.
Research shows mobile users scroll 40% less distance than desktop users on equivalent pages. Elements 3+ screens down effectively invisible.
WordPress-specific cause: Elementor and Divi marketed on visual design flexibility. Demos showcase desktop layouts. Mobile preview exists but agencies focus on desktop aesthetics. Page builder "mobile responsive" means elements stack—doesn't mean conversion flow works.
How to diagnose:
- Device-segmented conversion rates
- Mobile scroll depth analysis
- Mobile-specific heatmaps
- Session recordings filtered by mobile + quick exit
Example: Service page built in Elementor. Desktop: 3-column benefit layout, sidebar with CTA form, all above fold. Mobile: benefits stack requiring 2.5 screens of scrolling, CTA form appears screen 4.
Desktop conversion 3.8%, mobile conversion 0.7%. Mobile redesign: compressed benefits, CTA moved to screen 1: mobile conversion improves to 2.6%.
Mistake 6: Default WordPress Theme Typography Failing Readability
The mistake: Theme uses 11px-13px body text, low-contrast gray (#999999) on white background, decorative fonts for paragraphs. Mobile readability catastrophic.
Why it kills conversion: Low contrast forces visitors to strain reading. Small fonts require zooming on mobile. Decorative fonts slow comprehension. Visitors abandon rather than struggle.
Analysis shows landing pages with too much text convert 11.10% on average, while those with smaller word count have 14.30% conversion rates—but readability matters more than length. Unreadable short copy performs worse than readable long copy.
WordPress-specific cause: Theme designers prioritize aesthetics over readability. Demo sites use Lorem Ipsum—looks sophisticated at small sizes with low contrast. Real content becomes illegible when populated.
How to diagnose:
- Contrast checker tools (WCAG compliance testing)
- Readability scoring
- Time-on-page analysis (excessive time suggests reading difficulty)
- Mobile usability testing
Example: Corporate site using theme default: 12px text, #AAAAAA color (2.3:1 contrast ratio, failing WCAG 4.5:1 minimum). Average page time 4.2 minutes, bounce rate 71%.
Typography updated: 16px text, #555555 color (7.5:1 contrast): page time normalizes to 1.8 minutes, bounce rate drops to 43%.
Mistake 7: WooCommerce Checkout Creating Payment Friction
The mistake: WooCommerce default checkout requests 15+ fields including unnecessary data (company name, address line 2, phone for digital products). Checkout abandonment: 73%.
Why it kills conversion: Every field creates abandonment risk. WooCommerce defaults designed for maximum data capture, not conversion optimization.
Research on checkout optimization shows companies with 31 to 40 landing pages get seven times more leads than those with one to five pages—segmentation and targeting matter. But excessive checkout fields destroy benefits of traffic segmentation.
WordPress-specific cause: WooCommerce designed for physical product shipping—requires full address data. Digital products and services inherit same checkout structure despite not needing shipping information. Most agencies implement default checkout without conversion testing.
How to diagnose:
- Checkout funnel analysis (cart → checkout → payment → complete)
- Field-level abandonment tracking
- Cart abandonment rate
- Checkout completion time analysis
Example: Digital product store: checkout requests billing address, shipping address (despite no shipping), phone, company (optional but present). Add-to-cart rate 12%, checkout completion rate 27% (73% abandon).
Checkout simplified for digital products (name, email, payment only): completion rate jumps to 64%. Cart-to-purchase conversion improves from 3.2% to 7.7%.
When Fixing Beats Testing On WordPress Sites
Fix first (structural WordPress mistakes):
- Homepage slider hiding value proposition (not A/B testable—just wrong)
- Mobile CTA hidden in collapsed menu (responsive failure requiring fix)
- Plugin bloat destroying mobile performance (optimization issue, not design variable)
- Contact Form 7 requesting unnecessary fields (friction elimination, not testing opportunity)
- Page builder mobile layout collapse (structural problem requiring redesign)
- Typography failing WCAG contrast (accessibility requirement, not aesthetic choice)
- WooCommerce checkout requesting irrelevant data (configuration fix, not variation)
Test after fixing (optimization opportunities):
- Headline phrasing variations (all above fold, all readable—which resonates?)
- CTA button styling (all visible, all high-contrast—which converts better?)
- Product image approaches (all load fast—which builds trust?)
- Page length variations (foundation works—how much detail optimizes?)
- Checkout page layout (fields minimized—which arrangement converts highest?)
The distinction: WordPress mistakes have technically correct fixes. Optimizations require testing to identify better performers.
Red Flags From WordPress Developers Skipping Conversion Diagnosis
Red Flag #1: "We'll use [Popular Theme Name]—it's the #1 selling theme"
Translation: Theme selected for features/aesthetics, not conversion performance. Sales rank doesn't correlate with conversion rates. Professional approach: select theme based on conversion-focused architecture.
Red Flag #2: "We'll install these essential plugins to get started..."
Translation: Standard plugin stack implemented without conversion impact analysis. Professional approach: minimal plugin installation, each justified by conversion necessity.
Red Flag #3: "The site is mobile responsive—it works on all devices"
Translation: Elements stack on mobile but conversion flow never tested. Professional approach: mobile conversion flow validated, not just responsive CSS.
Red Flag #4: "We'll use Elementor/Divi so you can easily update pages yourself"
Translation: Page builder convenience prioritized over conversion performance. Professional approach: builder selection based on mobile conversion impact, not edit convenience.
Strong WordPress developers begin with conversion diagnosis:
- Performance budget before plugin selection
- Mobile conversion flow validated before desktop design
- Form field justification (why each field exists, abandonment cost)
- Load time testing at each development stage
- Only then: visual customization within conversion-validated structure
How BluePing Identifies WordPress Mistakes Before Development Waste
Before spending $10,000-$20,000 on WordPress development or redesigns, BluePing diagnostic reveals WordPress-specific conversion barriers—without revealing specific diagnostic methodology.
Use cases:
Use Case 1: Pre-development validation
Developer proposes WordPress site with Elementor builder, 30-plugin stack, Contact Form 7, homepage slider. BluePing reveals conversion impact predictions before development begins. Adjust architecture preventing expensive rebuilds.
Use Case 2: Existing site diagnosis
WordPress site converting 1.2%, unclear why. BluePing identifies specific WordPress configuration creating barriers (plugin bloat, mobile menu hiding CTA, form friction). Fix documented issues without full redesign.
Use Case 3: Theme selection validation
Choosing between 3 WordPress themes. BluePing analysis shows which theme architectures create fewest conversion barriers. Select based on conversion potential, not visual appeal.
Use Case 4: Plugin stack optimization
Site running 40 plugins, slow mobile performance. BluePing identifies which plugins cost most conversions through performance impact. Prioritize removal by conversion benefit.
The diagnostic prevents implementing WordPress in ways that maximize management convenience while destroying conversion performance.
Landing Page Optimization: The Diagnostic Framework Before Redesign explores the broader diagnostic framework preventing expensive optimization waste—applicable beyond WordPress to any platform.
.png)

.png)